Slow websites cost attention. Users do not like waiting, crawlers waste time on sluggish pages, and important content appears later than necessary. Still, PageSpeed is not an end in itself.
A fast page with poor content does not automatically become visible. But a slow page with very good content wastes user experience, conversion potential and technical quality.
This is exactly where the RankScan insight “Slow ” comes in.
The insight means: RankScan has found signals that a website or URL group loads too slowly or fails important performance metrics. This is a Website Health topic with Medium priority — not because load time is unimportant, but because it should always be assessed in the context of content, , page type and business value.
The right interpretation matters:
PageSpeed optimization does not mean chasing a perfect . The goal is a fast, stable and user-friendly page based on .
In this article, you will learn how to measure load time, PageSpeed and correctly, which metrics matter and which measures have the greatest effect.
- PageSpeed optimization improves load time, and .
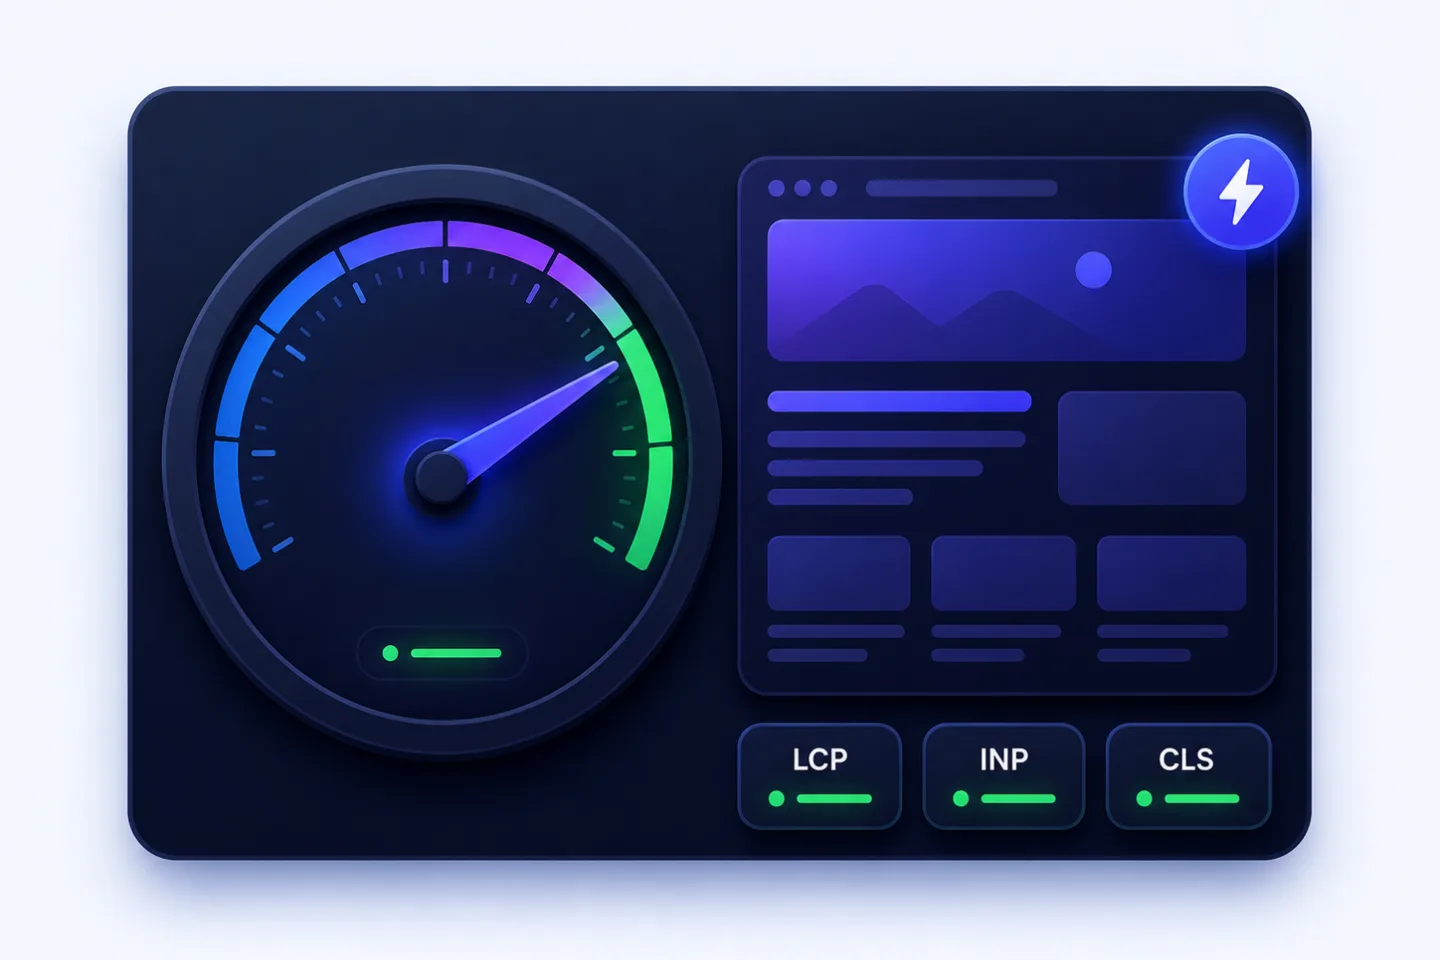
- The most important Core Web Vitals are , the point at which the largest visible content element has loaded; Interaction to Next Paint (INP), the page’s responsiveness to user interactions; and Cumulative Layout Shift (CLS), unexpected movement of layout elements.
- Google recommends good Core Web Vitals for success in Search and for good user experience in general.
- Core Web Vitals are evaluated using real user data, not only lab tests.
- The is decisive: at least 75% of page views should reach the good threshold.
- from Lighthouse helps with troubleshooting, but it does not replace .
- Common causes are oversized images, slow server responses, -blocking , too much JavaScript (JS), external scripts and layout shifts.
- The best workflow is: first check field data, then prioritize URL groups, then use lab data for diagnosis.
- The goal is “good enough for users and business”, not technical perfection.
- A good PageSpeed check prioritizes slow pages by page type, traffic, conversion value and affected Core Web Vital.
What Does “Slow Load Time” Mean? #
The RankScan insight “Slow Load Time” means that a page or URL group loads too slowly or shows performance problems that can affect user experience, or .
This can have several causes:
- slow server response,
- large images,
- uncompressed assets,
- ,
- too much JavaScript,
- slow third-party scripts,
- web fonts,
- layout shifts,
- missing ,
- no (CDN, a distributed server network for faster delivery),
- a heavy theme,
- plugin sprawl,
- client-side rendering.
Important: “Slow Load Time” should not stand as an isolated score. It should be connected to page type and relevance.
A slow product category with revenue potential is more important than a rarely visited archive page.
Why Load Time Matters for Search Engine Optimization (SEO) and Users #
Google describes Core Web Vitals as metrics that measure real user experience in the areas of loading performance, interactivity and visual stability. Google recommends that site owners achieve good Core Web Vitals, both for Search and for good user experience in general.
Source: Google Search Central – Understanding Core Web Vitals and Google Search results
The realistic interpretation:
- PageSpeed is part of page experience.
- Page experience can influence how pages perform in Google Search.
- But it does not replace , relevance, search intent, authority or technical indexability.
- Good load time helps especially where user experience and conversion matter.
Google explains in its page experience documentation that page experience is a factor for good content and search experience, but it is not more important than helpful, relevant content.
Source: Google Search Central – Understanding page experience in Google Search results
For RankScan, this means:
Slow pages do not automatically lose rankings, but they are a measurable quality and user-experience problem.
Core Web Vitals: LCP, INP and CLS #
Core Web Vitals measure three central aspects of user experience.
| Metric | Meaning | Good value |
|---|---|---|
| LCP | Loading performance: when has the largest visible content element loaded? | ≤ 2.5 s |
| INP | Interactivity: how quickly does the page respond to user interactions? | ≤ 200 ms |
| CLS | Visual stability: how much does the layout shift? | ≤ 0.1 |
web.dev describes Core Web Vitals as a set of metrics for loading experience, interactivity and visual stability. The recommended thresholds are evaluated at the 75th percentile.
Source: web.dev – Web Vitals
LCP: Make the Main Content Visible Faster #
Largest Contentful Paint measures when the largest visible element in the viewport has loaded.
Often this is the:
- hero image,
- article image,
- large ,
- product image,
- banner,
- large text block.
Poor LCP is often caused by:
- a large hero image,
- a slow server,
- render-blocking CSS,
- on the most important image,
- missing image prioritization,
- slow fonts,
- client-side rendering,
- third-party scripts.
How to Improve LCP #
Important measures:
- compress the hero image,
- use or AVIF, modern space-saving image formats,
- deliver with
srcset, - do not lazy-load the LCP image,
- prioritize the LCP image with
fetchpriority="high", - load critical CSS early,
- improve server response,
- delay unnecessary scripts,
- use a CDN for static assets.
Example:
<img
  src="/images/hero.webp"
  srcset="/images/hero-800.webp 800w, /images/hero-1600.webp 1600w"
  sizes="(max-width: 768px) 100vw, 1200px"
  width="1200"
  height="675"
  fetchpriority="high"
  alt="..."
>
INP: Improve Responsiveness #
Interaction to Next Paint measures how quickly a page responds to user interactions.
INP replaced the older FID metric. While FID only looked at the first interaction, INP evaluates responsiveness across all interactions on a page.
Poor INP is often caused by:
- too much JavaScript,
- long main-thread tasks,
- heavy frameworks,
- many third-party scripts,
- complex event handlers,
- large bundles,
- chat widgets,
- tracking scripts,
- client-side search or filters,
- unoptimized .
How to Improve INP #
Important measures:
- reduce JavaScript,
- use code splitting,
- delay non-critical scripts,
- review third-party scripts,
- split long tasks,
- optimize event handlers,
- avoid unnecessary re-renders,
- reduce hydration,
- load interactive components selectively.
For JavaScript-heavy websites, INP is often the most important performance lever.
CLS: Avoid Layout Shifts #
Cumulative Layout Shift measures how much elements unexpectedly move while a page is loading.
Poor CLS is often caused by:
- images without
widthandheight, - ads without reserved space,
- embedded videos without placeholders,
- banners that load later,
- cookie banners,
- web fonts,
- dynamic content above the visible area.
How to Improve CLS #
Important measures:
- specify width and height for images,
- reserve space for ads and embeds,
- position cookie banners in a stable way,
- optimize font loading,
- do not insert late-loading content above existing content,
- use skeletons or placeholders.
Example:
<img src="/product.webp" width="800" height="600" alt="Product">This lets the browser reserve space before the image has loaded.
The 75th Percentile: Why Averages Are Misleading #
Core Web Vitals are not evaluated by a simple average.
The recommended thresholds apply at the 75th percentile. This means that at least 75% of page views should reach the good value.
web.dev explains that tools for assessing Core Web Vitals should consider a page as passing when the recommended targets are reached at the 75th percentile of page views.
Source: web.dev – How Core Web Vitals thresholds were defined
Why this matters:
- A page can feel good for fast desktop users.
- Mobile users on weak connections can still have poor values.
- A few very slow users are not decisive on their own, but the majority must have a good experience.
- Mobile and desktop should be analyzed separately.
For RankScan, this means it is important not just to report a lab number, but to consider real user experience and URL groups.
Field Data vs. Lab Data #
PageSpeed optimization has two data worlds.
Field Data #
Field data is based on real users.
Sources:
- Chrome UX Report,
- PageSpeed Insights,
- Google Search Console Core Web Vitals,
- Real User Monitoring,
- analytics with Web Vitals tracking.
Google Search Console describes the Core Web Vitals report as an evaluation of real usage data. The data comes from the Chrome UX Report and is shown by URL groups.
Source: Google Search Console Help – Core Web Vitals report
Field data tells you:
Do real users have a problem?
Lab Data #
Lab data is generated in a simulated test environment.
Sources:
- Lighthouse,
- Chrome DevTools,
- WebPageTest,
- the lab section in PageSpeed Insights,
- local performance tests.
Lab data tells you:
Where could the technical problem be?
The Most Important Rule #
Field data shows whether a problem is relevant. Lab data helps identify the cause.
How to Measure PageSpeed Correctly #
A useful measurement workflow looks like this.
1. Check Google Search Console #
Start with the Core Web Vitals report.
Check:
- mobile and desktop separately,
- poor URL groups,
- affected metric,
- number of affected URLs,
- page types,
- development over time.
2. Use PageSpeed Insights #
Test representative URLs for each URL group.
Check:
- field data,
- lab data,
- LCP element,
- render-blocking resources,
- unused JavaScript,
- image sizes,
- ,
- layout shifts.
3. Use Lighthouse for Diagnosis #
Do not use Lighthouse as the only goal. Use it as a diagnostic tool.
A 100/100 score is not always economically sensible. It is more important to fix real user problems on important pages.
4. Use WebPageTest or DevTools for Details #
For technical teams, the following are helpful:
- waterfall analysis,
- Time to First Byte (TTFB), the time until the first byte of the server response,
- resource timing,
- main-thread work,
- third-party scripts,
- filmstrip,
- CPU throttling,
- network conditions.
5. Set Up Real User Monitoring #
For larger websites, RUM is worthwhile.
It helps you identify:
- real user devices,
- slow countries or regions,
- browser differences,
- page templates,
- outliers,
- conversion impact.
Prioritization: Which Slow Pages Matter? #
Not every slow URL needs to be optimized immediately.
| Situation | Priority | Why |
|---|---|---|
| Important product or category page is slow | High | Revenue and relevance |
| Landing page with campaign traffic is slow | High | Direct conversion costs |
| Pages with many organic clicks are slow | High | User experience and visibility |
| Entire URL group with poor LCP | High | Template problem |
| Poor INP caused by a global script | High | Affects many pages |
| CLS across all templates | Medium to high | Broad user-experience problem |
| Rarely visited archive page is slow | Low | Low impact |
| page is slow | Low | Usually not an SEO focus |
| Isolated lab warning without field-data problem | Low to medium | Review, but do not overreact |
The most important rule:
Start optimization where many real users, important rankings or conversion goals are affected.
The Biggest PageSpeed Levers #
1. Optimize Images #
Images are often the biggest LCP lever.
Measures:
- use WebP or AVIF,
- size images correctly,
- use responsive images with
srcset, - compress images,
- prioritize the LCP image,
- lazy-load only below the fold,
- use meaningful placeholders,
- do not forget .
Common mistake:
<img src="hero.jpg" loading="lazy">when this image is the LCP element.
Better:
<img src="hero.webp" fetchpriority="high">2. Improve Server Response #
TTFB is not directly a Core Web Vital, but it strongly affects LCP.
Measures:
- good hosting,
- page caching,
- object cache,
- OPcache,
- database optimization,
- CDN,
- (HTTP) version HTTP/2 or HTTP/3,
- compression,
- avoid unnecessary ,
- edge caching.
If the server responds slowly, no frontend optimization can fully rescue LCP.
3. Optimize CSS #
CSS can block rendering.
Measures:
- prioritize critical CSS,
- remove unused CSS,
- minify CSS,
- reduce large framework files,
- bundle CSS cleanly or split it selectively,
- avoid unnecessary nesting of fonts and CSS.
4. Reduce JavaScript #
Too much JavaScript is often the cause of poor INP and LCP.
Measures:
- remove scripts that are not needed,
- use code splitting,
- use
deferorasync, - critically review third-party scripts,
- delay chat widgets,
- clean up tracking tags,
- reduce framework hydration,
- split long tasks.
For JavaScript-heavy pages, the article JavaScript SEO: Identify Rendering Problems is also relevant.
5. Optimize Fonts #
Web fonts can affect load time and CLS.
Measures:
- load only the required font weights,
- host fonts locally or deliver them efficiently,
- use
font-display: swapor another suitable strategy, - evaluate preload for central fonts,
- use variable fonts sensibly,
- choose fallback fonts with similar metrics.
6. Control Third-Party Scripts #
Many pages are slow not because of their own content, but because of third-party providers.
Typical scripts:
- tracking,
- tag managers,
- chat,
- heatmaps,
- A/B testing,
- cookie banners,
- ads,
- social widgets,
- review widgets.
Check:
- Is the script really needed?
- Does it have to load immediately?
- Can it load after consent or interaction?
- Are there leaner alternatives?
- Does it cause long tasks?
- Does it affect INP?
PageSpeed Optimization in WordPress and Content Management Systems (CMS) #
Many performance problems arise in the setup.
WordPress #
Common causes:
- too many plugins,
- heavy theme,
- page builders,
- unoptimized images,
- no caching,
- many external scripts,
- unoptimized database,
- unused CSS/JS files,
- poorly configured fonts.
Important measures:
- plugin audit,
- server-side caching,
- image optimization,
- database cleanup,
- remove unnecessary page-builder modules,
- check critical CSS,
- use a CDN,
- reduce theme weight.
Craft CMS, TYPO3, Laravel, Headless #
In custom setups, the levers are often different:
- template caching,
- query optimization,
- eager loading,
- asset transformations,
- CDN,
- and Static Site Generation (SSG),
- response times,
- frontend bundle size,
- image pipelines,
- edge caching.
Performance findings should therefore be grouped by template or page type whenever possible.
What to Do After a RankScan Finding #
When RankScan reports “Slow Load Time”, proceed in a structured way.
Step 1: Determine the Affected URL Group #
Check whether it affects:
- a single URL,
- all blog articles,
- all product pages,
- all categories,
- the homepage,
- landing pages,
- mobile or desktop,
- specific countries or devices.
Step 2: Check Field Data #
Use:
- Google Search Console,
- PageSpeed Insights,
- CrUX,
- Real User Monitoring.
Ask:
Is the problem visible for real users?
Which metric fails?
Mobile or desktop?
Which URL group is affected?
Step 3: Run a Lab Diagnosis #
For representative URLs:
- Lighthouse,
- PageSpeed Insights,
- WebPageTest,
- Chrome DevTools.
Check:
- LCP element,
- TTFB,
- image size,
- CSS/JS blockers,
- main-thread time,
- third-party scripts,
- layout shifts.
Step 4: Prioritize the Cause by Metric #
| Problem | First measure |
|---|---|
| Poor LCP | Check hero image, TTFB, CSS and LCP prioritization |
| Poor INP | Check JavaScript, long tasks and third-party scripts |
| Poor CLS | Check image dimensions, ads, fonts and late-loading elements |
| Slow server | Check hosting, cache, database and CDN |
| Poor mobile values | Check image sizes, JS, network and CPU |
Step 5: Implement Measures #
Start with the largest lever.
Not useful:
20 small optimizations without a measurement basis
Better:
one URL group
one main metric
one clear technical bottleneck
one measurable measure
Step 6: Validate #
After implementation:
- test again with Lighthouse,
- start validation in Google Search Console (GSC),
- monitor RUM data,
- consider the 28-day window,
- do not evaluate rankings and conversions in isolation,
- crawl again with RankScan.
Core Web Vitals field data does not react immediately. Depending on the data situation, it can take several weeks until improvements become stable in Search Console and CrUX.
What a Good PageSpeed Check Looks At #
A good PageSpeed check should do more than report a single load time.
A good check reviews:
- LCP,
- INP,
- CLS,
- TTFB,
- total page weight,
- image weight,
- unoptimized images,
- render-blocking CSS,
- unnecessary JavaScript,
- third-party scripts,
- font loading behavior,
- missing image dimensions,
- lazy loading on LCP elements,
- caching headers,
- compression,
- CDN usage,
- mobile vs. desktop,
- URL groups,
- page types,
- organic traffic,
- conversion relevance,
- template patterns,
- connection with JavaScript SEO.
This turns “Slow Load Time” into a prioritizable Website Health workflow.
Example: Poor LCP Caused by the Hero Image #
Initial Situation #
A B2B blog has good content, but poor mobile Core Web Vitals. RankScan reports:
“Slow Load Time”
Google Search Console shows poor LCP for blog articles.
Analysis #
PageSpeed Insights shows:
- the LCP element is the hero image,
- the image is 2.8 MB,
- the image is served as PNG,
- the image is larger than necessary,
loading="lazy"is active on the hero image,- a chat widget loads immediately.
Solution #
- Convert the hero image to WebP/AVIF.
- Deliver responsive image sizes.
- Remove lazy loading for the LCP image.
- Set
fetchpriority="high". - Load the chat widget only after interaction.
- Check page cache.
- Measure again after deployment.
Result #
LCP improves significantly. Whether rankings change depends on additional factors. What definitely improves is the user experience on the affected pages.
Common Mistakes in PageSpeed Optimization #
Mistake 1: Chasing Lighthouse 100/100 #
A perfect lab score is not the goal. Real user data and business-relevant pages matter more.
Mistake 2: Lazy-Loading the LCP Image #
The most important above-the-fold image should not be delayed.
Mistake 3: Testing Only Desktop #
Many problems appear on mobile because of weaker CPUs, slower connections and higher JavaScript costs.
Mistake 4: Ignoring Third-Party Scripts #
Chat, tracking, consent and A/B testing can strongly affect performance.
Mistake 5: Not Working With URL Groups #
If a template is affected, the template must be optimized — not just one individual URL.
Mistake 6: Selling PageSpeed as a Ranking Hack #
Fast pages help, but they do not replace search intent, content or technical indexability.
Mistake 7: Explaining AI Crawlers Too Generally With PageSpeed #
Fast, server-side available content is helpful for crawlers. But there is no general guarantee that simply “ignore” slow pages. More important are accessibility, initial Hypertext Markup Language (HTML), status codes, robots.txt and rendering.
Checklist: Optimize PageSpeed and Core Web Vitals #
Use this checklist:
- Is field data available in Search Console or PageSpeed Insights?
- Is mobile or desktop affected?
- Which URL group is affected?
- Which metric is poor: LCP, INP or CLS?
- What is the LCP element?
- Is the LCP image optimized and prioritized?
- Is there render-blocking CSS?
- Is there too much JavaScript?
- Are there long tasks?
- Are third-party scripts necessary?
- Are images correctly sized?
- Are
widthandheightset? - Are there layout shifts caused by ads, banners or fonts?
- Is caching active?
- Is compression active?
- Is the server fast enough?
- Are important pages validated again?
- Is the effect checked through field data?
In addition, AI Readiness Score, Improve Google Rankings and 404 Errors help narrow down the cause cleanly and prioritize the next SEO measures.
Frequently Asked Questions (FAQ) About PageSpeed Optimization #
What is PageSpeed optimization?
PageSpeed optimization includes measures that improve a website’s load time, responsiveness and layout stability.
What are Core Web Vitals?
Core Web Vitals are Google metrics for real user experience: LCP for loading performance, INP for interactivity and CLS for visual stability.
Which Core Web Vitals values are good?
LCP should be no more than 2.5 seconds, INP no more than 200 milliseconds and CLS no more than 0.1.
Are Core Web Vitals a ranking factor?
Core Web Vitals are part of page experience and can play a role in Google Search. But they are not more important than helpful, relevant content.
Why do Lighthouse and Search Console differ?
Lighthouse measures in a simulated lab environment. Search Console uses real user data from the Chrome UX Report. That is why the values can differ significantly.
What is more important: field data or lab data?
Field data shows whether real users are affected. Lab data helps identify technical causes. Field data is more important for prioritization.
What is the 75th percentile?
It means that at least 75% of page views should reach the good threshold.
How can I improve my website’s load time?
Start with images, server response, caching, CSS, JavaScript, fonts and third-party scripts. Prioritize by affected URL group and metric.
Should I lazy-load all images?
No. Images below the visible area can be lazy-loaded. The most important above-the-fold image should not be lazy-loaded.
What does “Slow Load Time” mean in RankScan?
The insight means that RankScan has detected performance problems that may affect load time, user experience or Core Web Vitals.
Conclusion: PageSpeed Is a User and Quality Lever, Not a Perfection Game #
PageSpeed optimization is important, but it should be measurable and prioritized.
The RankScan insight “Slow Load Time” shows where load time or Core Web Vitals are likely to be a problem. What matters next is not a perfect score, but the right diagnosis:
- check field data,
- identify affected URL groups,
- determine LCP, INP or CLS as the main problem,
- analyze the technical cause in the lab,
- fix the biggest lever first,
- prioritize important pages and templates,
- validate the effect through real user data.
This turns PageSpeed from an endless developer task into a controlled Website Health process for better user experience, more stable technical quality and better conditions for search visibility.